Lab 3: Connect the Dots Generator Revisited
Learning Outcomes
- Perform algorithmic time complexity analysis on the algorithms
- Conduct benchmarking and analyze the results
Resources
Overview
This assignment focuses on algorithmic analysis and benchmarking. While
you will still need to write and deliver code, the main deliverable is
a report analyzing algorithmic time complexity and results of benchmarking
experiments. You will update your solution to the previous assignment based on
feedback from your instructor and enhance its functionality. The key
enhancements will allow you to compare the efficiency of using iterators
versus indices when accessing elements in LinkedLists.
While this assignment builds on the previous two assignments, you will create a command line user interface and abandon the GUI used previously.
Assignment
You will use the functionality developed in lab 2 to complete the following:
- Incorporate feedback from your instructor from lab 2
- Develop a method for removing dots from a
Collection<Dot> - Benchmark the time required to remove dots from a
LinkedListusing both index and iterator methods - Perform algorithmic time complexity analysis on the algorithms to remove dots and compare those with your benchmarking data
Details
Refactoring keepDots() Method
You must refactor keepDots() in the Picture class so that it now accepts
the arguments (int numberDesired, String strategy) and uses the second to
determine which of the following two private static methods to call:
indexedKeepDots(List<Dot> dots, int numberDesired)which should have the functionality that was in the lab 2 implementation ofkeepDots()but now returns alongthat represents the number of nanoseconds required for the algorithm to run.iteratedKeepDots(Collection<Dot> dots, int numberDesired)that produces the same result asindexedKeepDots()but uses one or more iterators to traverse the collection of dots.
All of these methods must return the number of nanoseconds required to complete the method call. You may find System.nanoTime() useful for this.
Command Line Program
Replace your GUI with a command line program that is run from the command line like this:
java username.BenchmarkDot2Dot data/noisy_circle_125.dot 25 index linkedlistThe command specifies the following command line arguments:
data/noisy_circle_125.dot— path to the data file25— the number of desired dots (here it would remove 100 of the original 125 dots)index— specifies the removal approach (eitherindexoriterate)linkedlist— specifies the data structure used (eitherlinkedlistorarraylist)
The program should display to the console the number of microseconds the program took to remove the dots.
You may find it useful to reference SLM 10 from CS1021.
Results and Discussion
The goal of this assignment is to gain experience analyzing the performance of different implementations. Be sure to devote sufficient time and energy to this analysis. Here you will model the growth rates of two scenarios both theoretically (big-O analysis) and empirically (benchmarking):
indexedKeepDots()when using aLinkedList.iteratedKeepDots()when using aLinkedList.
Create a Word document that includes the components described below. Unless
otherwise directed by your instructor, place it in your project folder (same
level as the src folder and add it to your repo. Be sure to commit and push
it with the rest of your solution to this assignment.
Big-O Analysis
In your report, you must outline your asymptotic time analysis for the above scenarios. Your analysis must include a discussion clearly justifying the \( O( ? ) \) answer for each scenario. Use \( n \) to indicate the number of dots in the list before any are removed.
It may be helpful to review the run times of accessing a single element of
LinkedList by calling next() on an iterator and theLinkedList.get(int)
method.
Benchmarking
Your must also benchmark your code for both of the above scenarios. In your benchmarks, you will vary the number of dots in the drawings but always remove the same number of dots. This is because we want to assess the impact of a single change at one time.
You have been provided the following files (see the data folder in the
project) to use in your benchmarks:
noisy_circle_125.dotnoisy_circle_250.dotnoisy_circle_500.dotnoisy_circle_1000.dotnoisy_circle_2500.dotnoisy_circle_5000.dotnoisy_circle_7500.dotnoisy_circle_10000.dot
You should have your program remove 100 dots from each drawing and record the time (in microseconds). Note that your program takes input in the form of the number of dots that should remain after the removal. You must calculate the number of remaining dots for each drawing (e.g., 125 - 100 = 25 desired dots) to ensure that only 100 dots are removed.
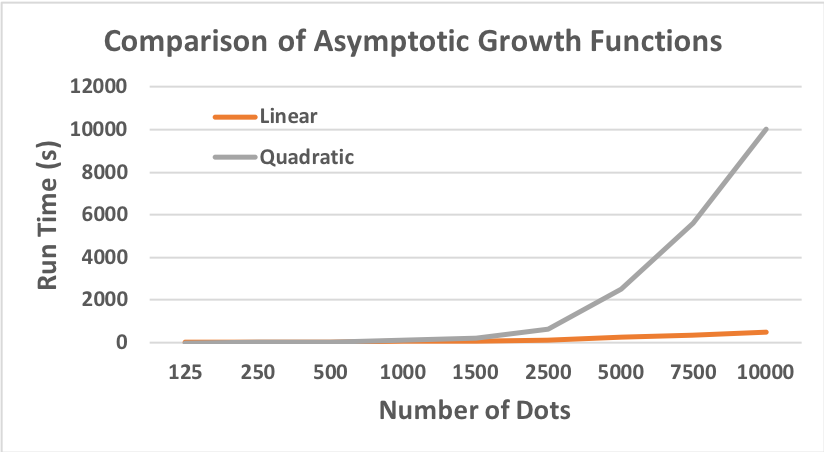
Graph these data in Excel and compare your plot with your aysmptotic time analysis. You should put the independent variable (number of dots in the drawing) on the horizontal axis and the dependent variable (run time) on vertical axis. Your graph should have appropriate axis labels, a title, and a legend. The sample graph shows idealized linear and quadratic functions as an example:
Interpreting Your Results
In your report, you should answer the following questions:
- From your benchmarks, the run time of which scenario grows more slowly as \( n \) is increased? The run time of which scenario grows more quickly as \( n \) is increased?
- From your big-O analysis, the run time of which scenario grows more slowly as \( n \) is increased? The run time of which scenario grows more quickly as \( n \) is increased?
- Are the results from your benchmarks and big-O analysis consistent?
Just For Fun
Ambitious students may wish to:
- Just for Fun suggestions from lab 2
- Benchmark the two iteration strategies with
ArrayLists - Benchmark lecture/homework implementations of the
ArrayListandLinkedList - Create an interactive game where the user can draw lines between the dots, but only if they select the dots in the right order.
- Graph benchmark result in your UI
- Save dots images as
.pngimages
Acknowledgment
This laboratory assignment was developed by Dr. Chris Taylor.